Why have students create infographics?
Infographics require students to synthesize information and present it in a visual way forcing students to highlight only the most important information and be able to communicate it with icons, graphs, and charts.
In other words, it's not an easy task! It also allows students to be creative giving them the choice of how they want to present information. Allowing students to learn and experiment with graphic design is also an important skill for them to practice.
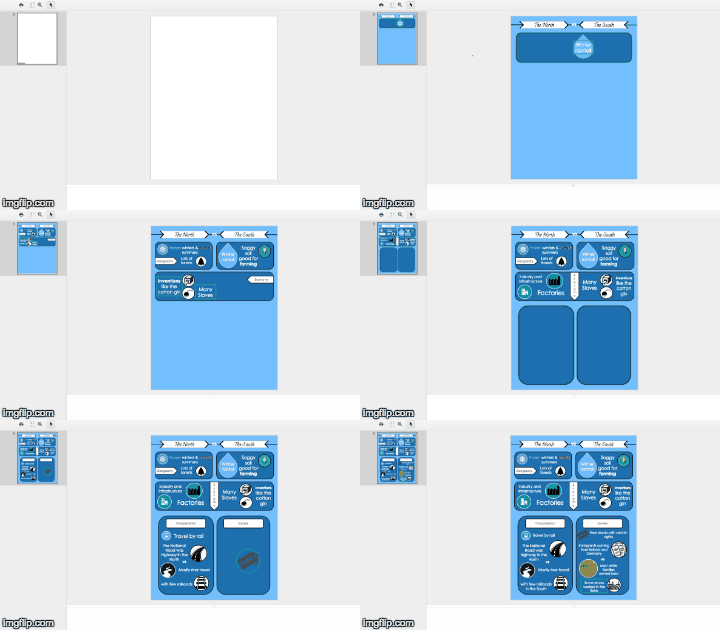
The worlds of North and South infographic assignment
This assignment aligns with our textbook's chapter on "The Worlds of North and South." Students were first introduced to infographics with the slides below explaining what infographics are, the assignment requirements, and Google Drawings tips from Nancy Minicozzi's presentation on Google Drawings 101 used with permission.
I especially love sharing the Google Drawings tutorial videos (here and here) to show students that it is possible to create banners and icons using shapes and inspire students to create their own.
I also share with students how to search for "free for reuse" icons from Google Images and Creative Commons search. The Noun Project is another awesome resource for icons. Students were expected to provide proper attribution and citations for all icons used that were not created by them.
The last slide is an infographics toolbox resource where students can copy and paste icons from.
Using Google Slides (or Drawings) to create infographics
Note: This assignment can also be done on Google Drawings, but I prefer to use Slides to easily copy and paste student assignments to a shared slide deck.
Students were given a Google Slides file with a single blank slide to create their infographic on. For icons, students were encouraged to create their own, search for free for reuse icons on Google Image search, search for icons on Creative Commons, or search for icons on The Noun Project. Students were also required to provide proper attribution for icons used that were not created by them.
 |
| Example of a vertical infographic template |
 |
| Example of a horizontal infographic template |
Why Google Slides?
While I gave the option to work individually, in pairs, or small group of three, only a few chose to work individually. Google Slides allowed students to collaborate on this assignment which is powerful when discussing and choosing the information to include on the infographic. Also, while other websites like Piktochart and Canva provide templates for students, I liked seeing what my students were able to create with a blank canvas. This resulted in a wide variety of infographics showing how my students interpreted the information differently and chose to present it in different ways.
Examples of student work
I was beyond impressed to see what my students were able to create! They designed their own templates and decided on their own color schemes and typography. Many were able to create their own icons using shapes!
What else can students make infographics for?
Anything! The 7th grade history teachers at my school had their students comparing and contrasting feudal European knights with Japanese samurai.
Have you had your students create infographics in your classroom? I'd love to see more examples of infographics created by students. Comment below or connect with me on Twitter!

I do agree with all of the ideas you have presented in your post. They are really convincing and will certainly work. Still, the posts are very short for newbies. Could you please extend them a bit from next time? Thanks for the post. Web designer in Singapore
ReplyDelete
ReplyDeleteHey
Thank you for this amazing article!
I am looking for a long time. I have benefited a lot from reading this article, I want more post about that.
Thanks again for this useful guide.